Ohio Common Ground Research Center
OCG Visual Library
See the issue. Understand the facts.
Explore Ohio's important issues through charts, data, explainers, infographics and other visual resources created by the Ohio Common Ground Research Center.
Explore by Topic
Explore OCG visual research organized around the issues shaping Ohio.
Data Centers & AI
Power, water, economics, infrastructure and policy questions surrounding Ohio's rapidly expanding data-center industry.
Explore Topic →Start Here
New to an issue? Start with a curated sequence designed to build understanding one visual at a time.
Data Centers & AI: Start Here
A curated sequence of visuals that introduces the key power, water, economic and policy questions surrounding Ohio data centers.
Start Learning Path →Latest Visuals
The newest charts, explainers, data graphics and infographics from the OCG Research Center.
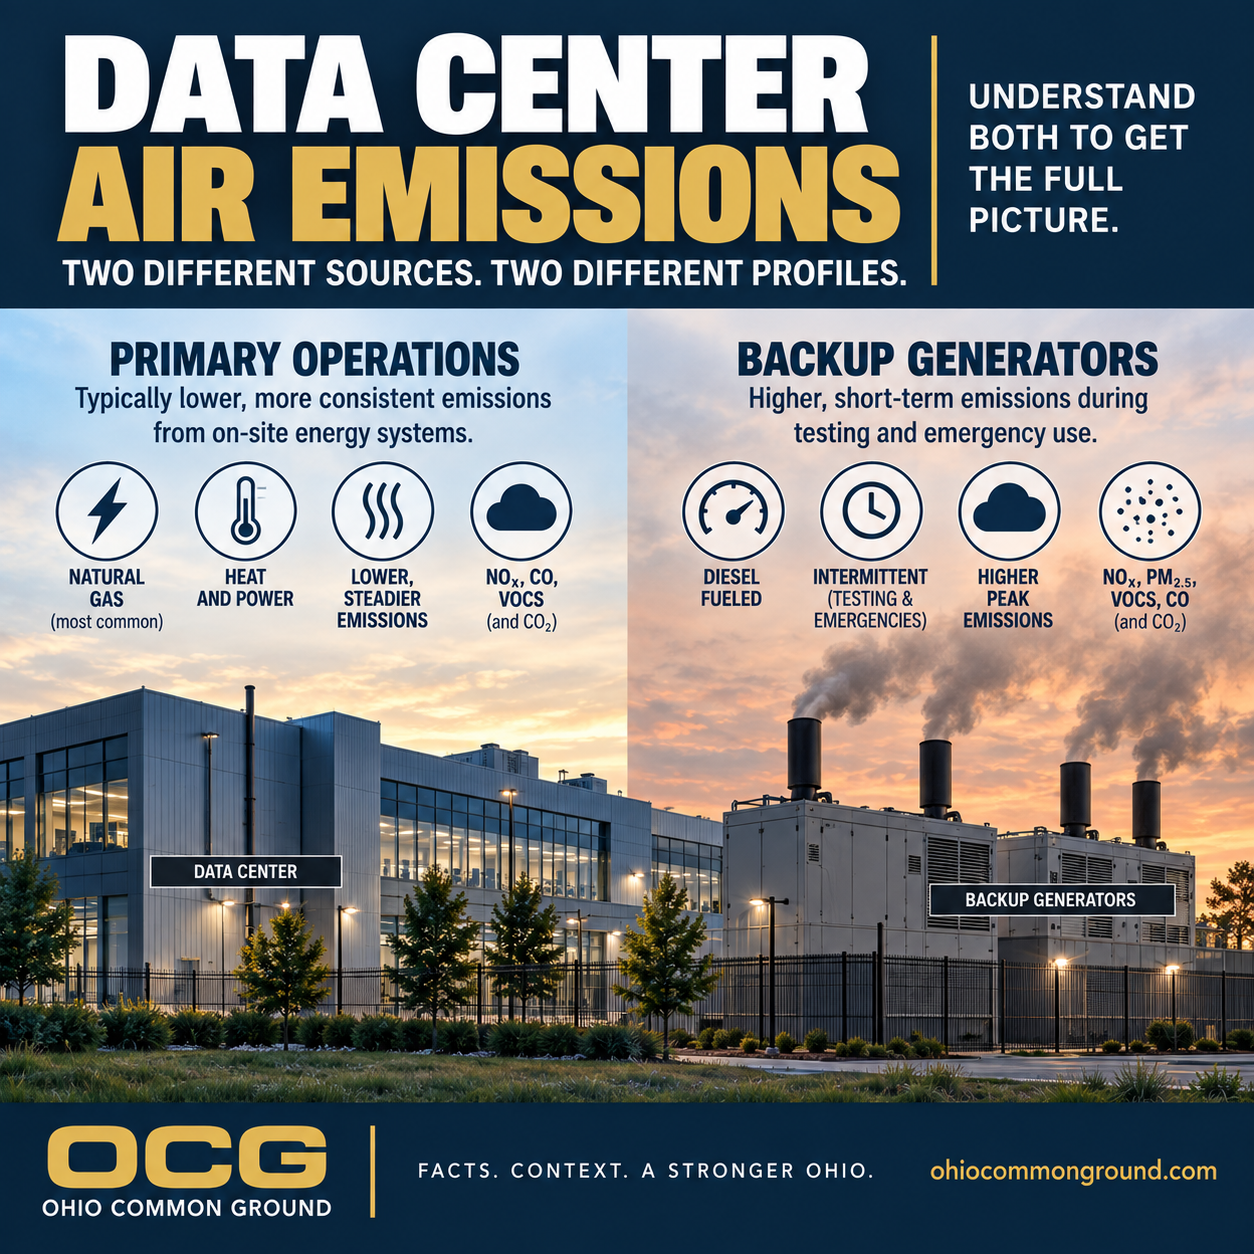
Air Emissions: Backup vs. Primary Power
Emergency backup generators and routinely operated power generation create different air-quality questions. Operating purpose and hours matter as much as the number of engines.
View Visual →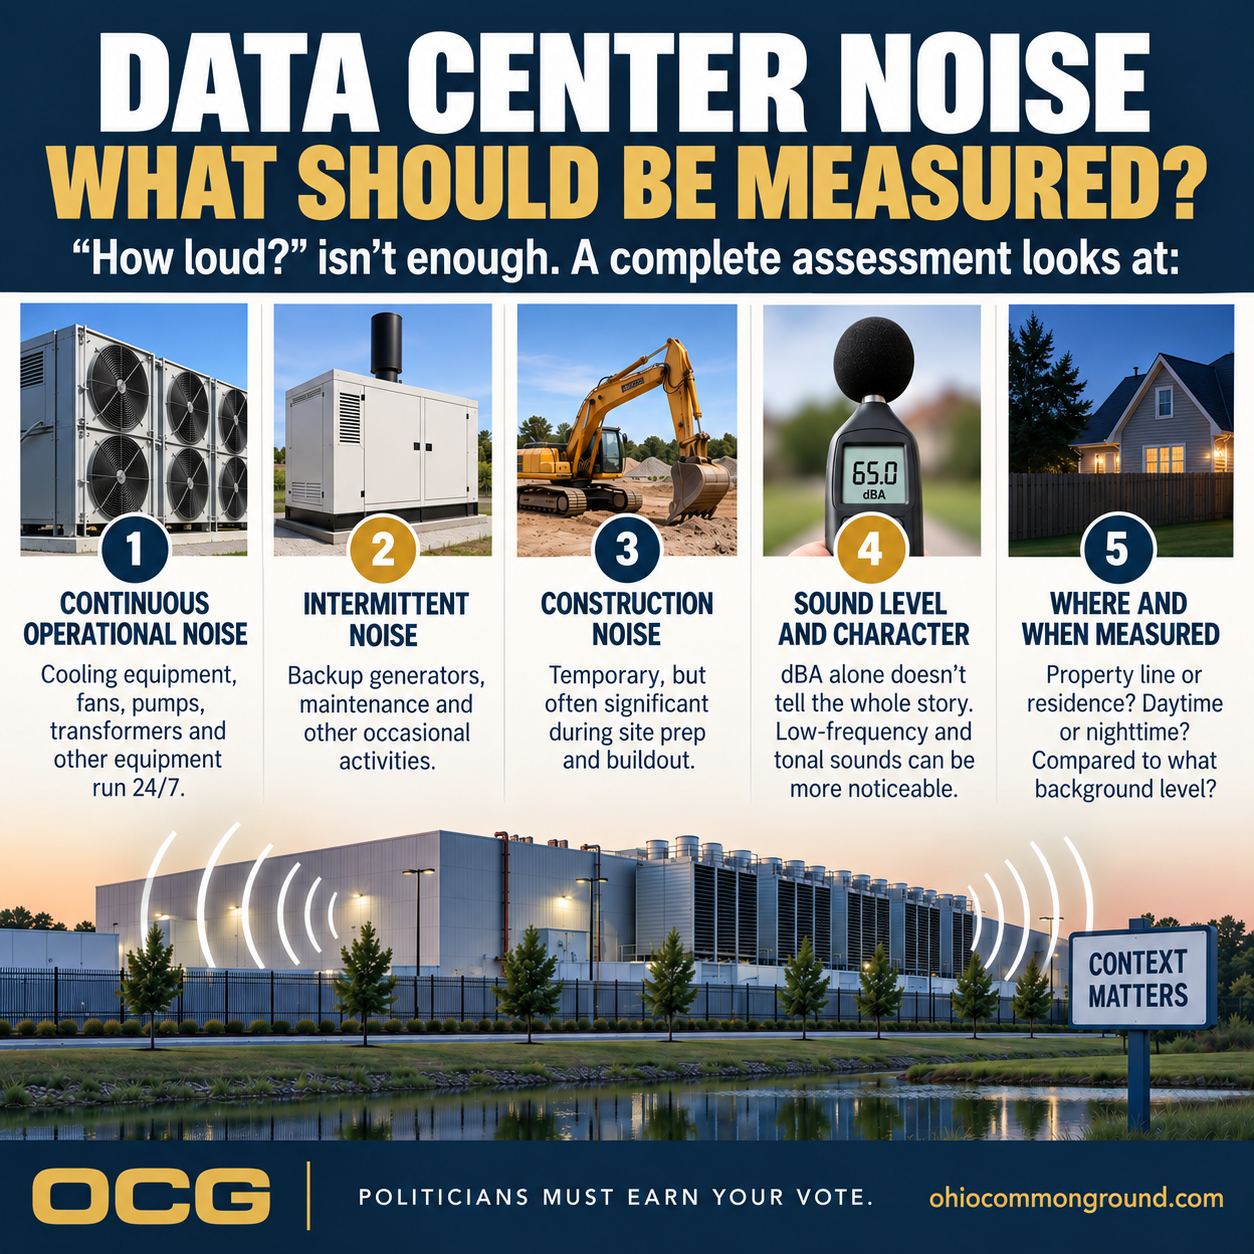
Data Center Noise: What Should Be Measured?
Evaluating data-center noise requires more than one dBA number. Source, location, timing, operating condition, background sound and tonal or low-frequency characteristics can all matter.
View Visual →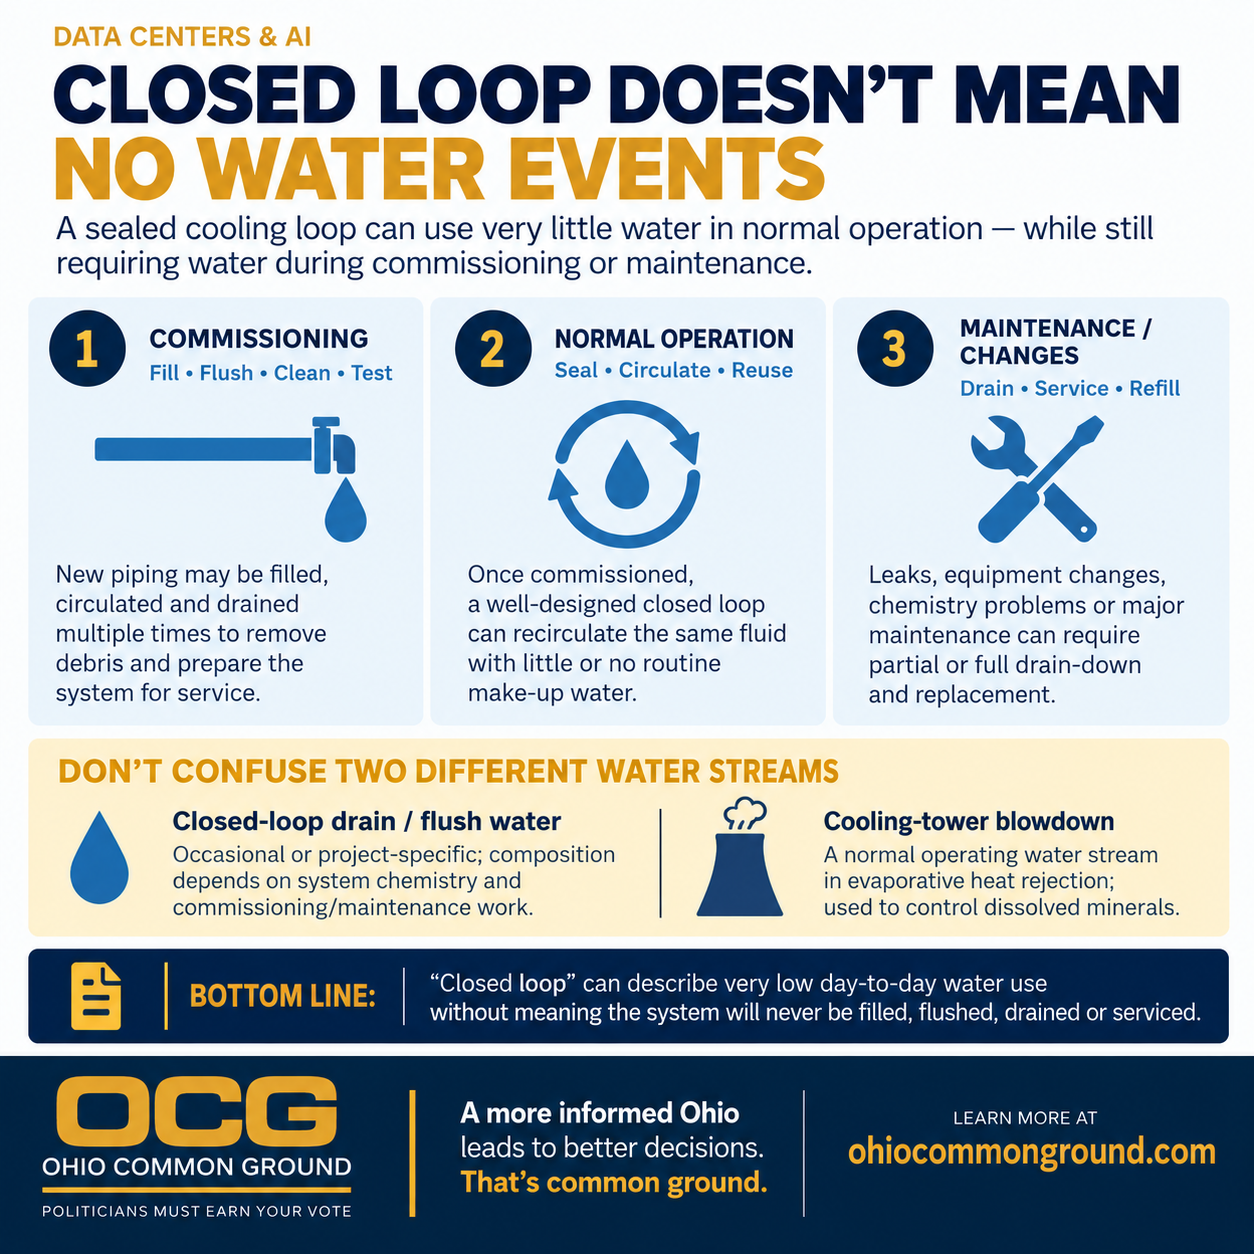
Closed Loop Doesn't Mean No Water Events
Closed-loop cooling can use very little water during normal operation while still requiring filling, flushing, testing or drain-down during commissioning and maintenance.
View Visual →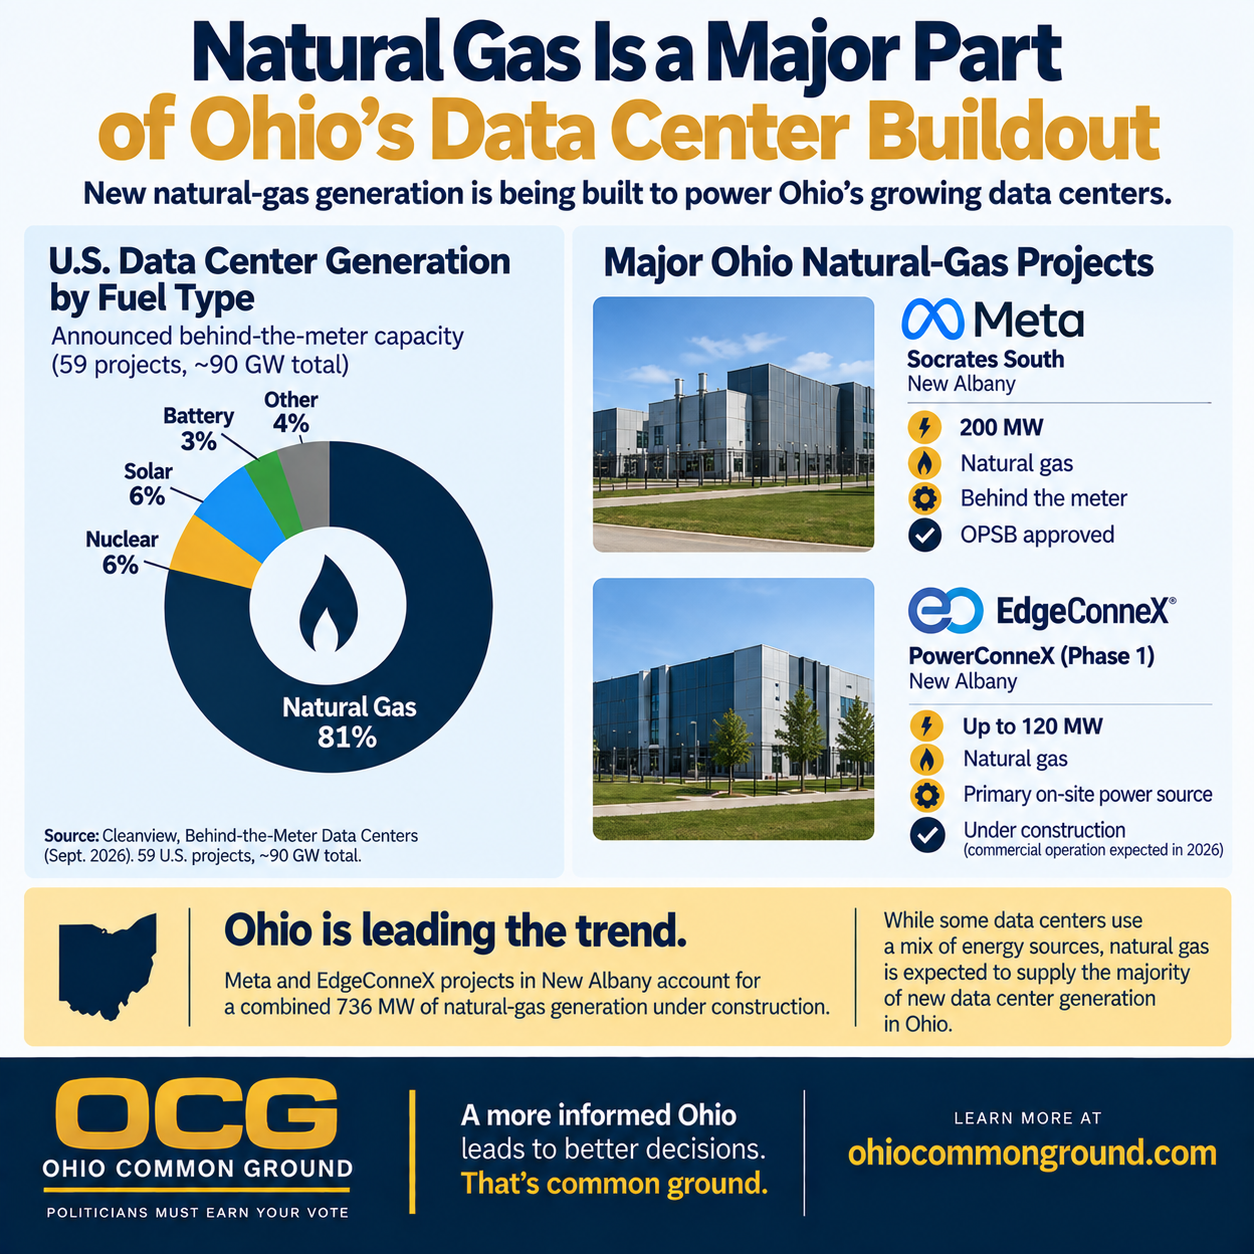
Natural Gas Is a Major Part of Ohio's Data Center Buildout
Ohio data-center growth is already driving substantial new natural-gas generation, including 736 MW of behind-the-meter gas capacity under construction for Meta and EdgeConneX projects in New Albany.
View Visual →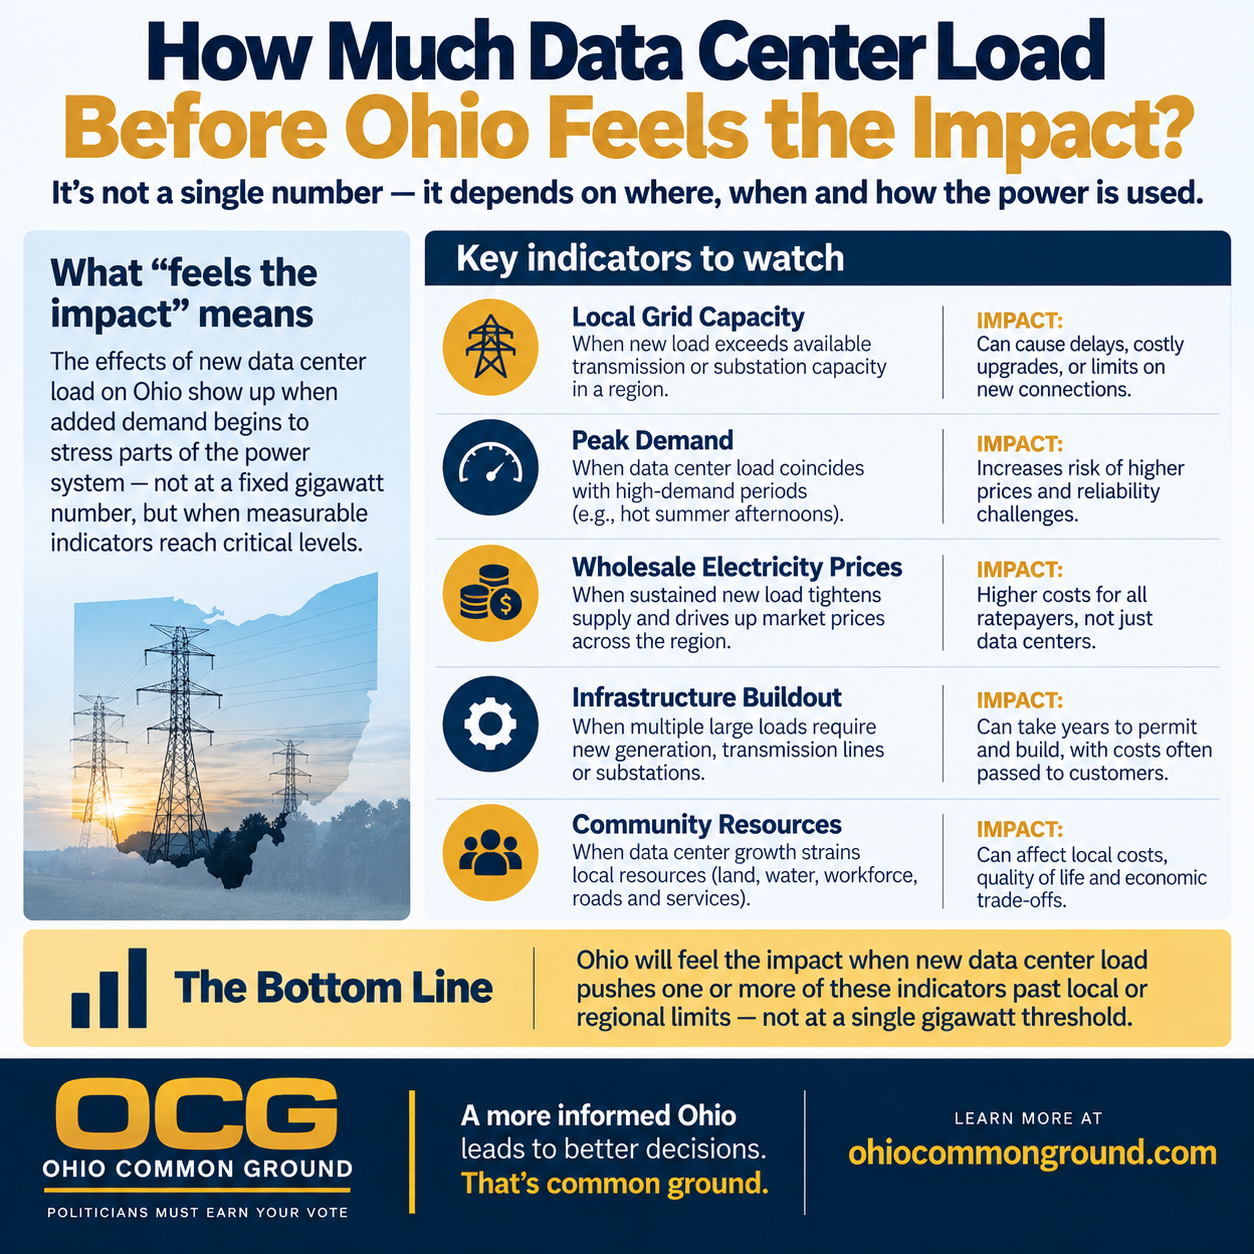
How Much Data Center Load Before Ohio Feels the Impact?
There is no single gigawatt threshold at which data centers begin affecting Ohio. The useful indicators are contracted load, grid constraints, peak demand, infrastructure requirements, costs and local resource impacts.
View Visual →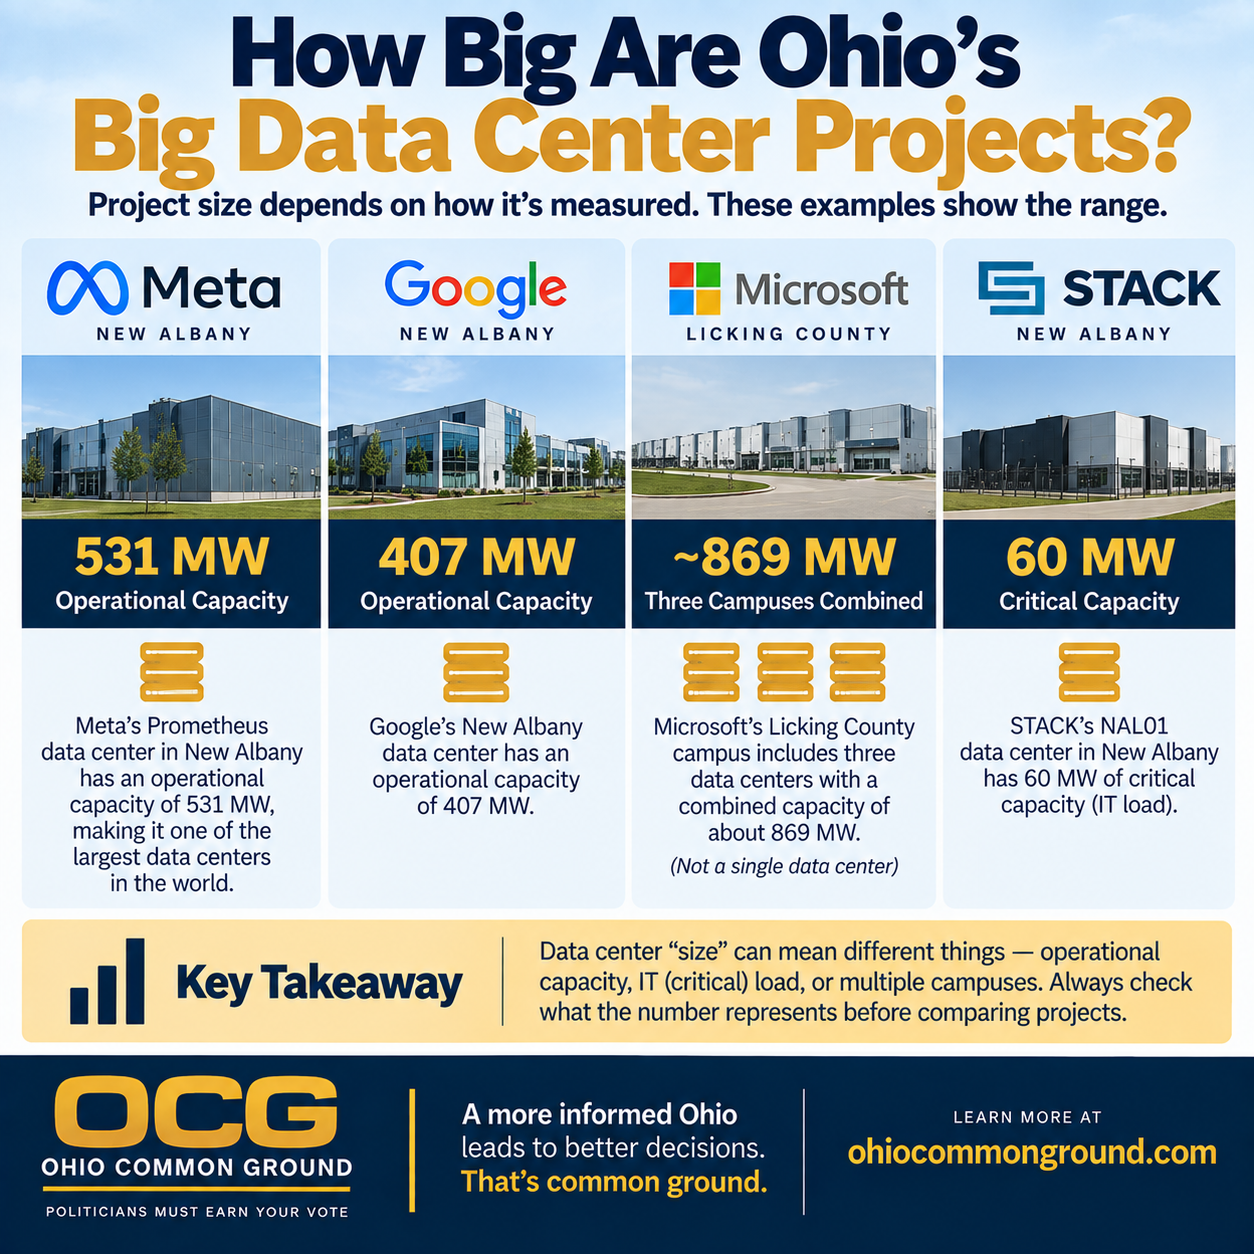
How Big Are Ohio's Big Data Center Projects?
Ohio data-center capacity figures can describe operational power, critical IT load, future power envelopes or multiple campuses combined. Define the metric before ranking projects.
View Visual →